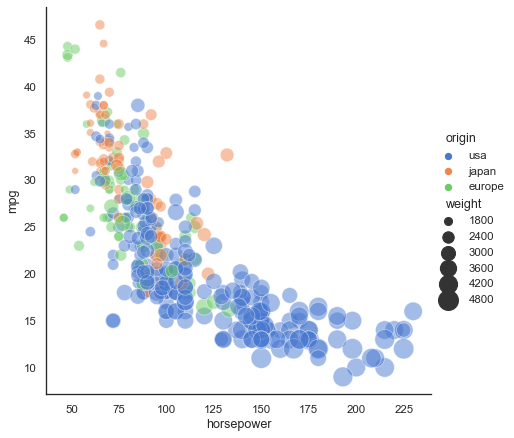
Scatterplot with varying point sizes and hues
seaborn components used: set_theme(), load_dataset(), relplot()
import seaborn as sns
sns.set_theme(style="white")

# Load the example mpg dataset
mpg = sns.load_dataset("mpg")

# Plot miles per gallon against horsepower with other semantics
sns.relplot(x="horsepower", y="mpg", hue="origin", size="weight",
            sizes=(40, 400), alpha=.5, palette="muted",
            height=6, data=mpg)